
A portfolio of analytics engagements across construction, real estate, HR, and insurance — each solving a distinct business problem with Power BI.
Clients
Industries served
Countries
Certified Professionals
THE CHALLENGE
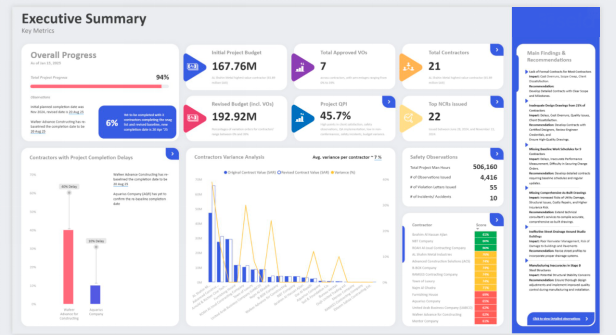
A major entertainment destination programme in KSA had 21 active contractors working in parallel with zero consolidated visibility. Budget tracking, delay reporting, quality compliance, and safety data all lived in separate silos — forcing leadership to make decisions two weeks behind reality.
THE SOLUTION
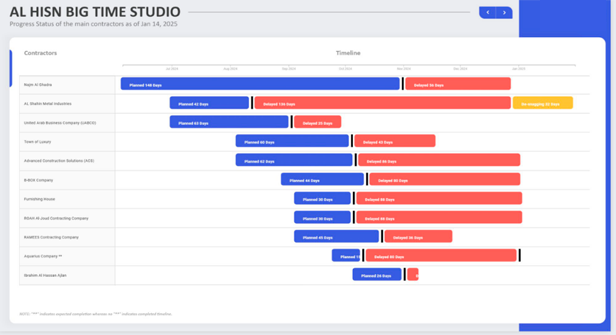
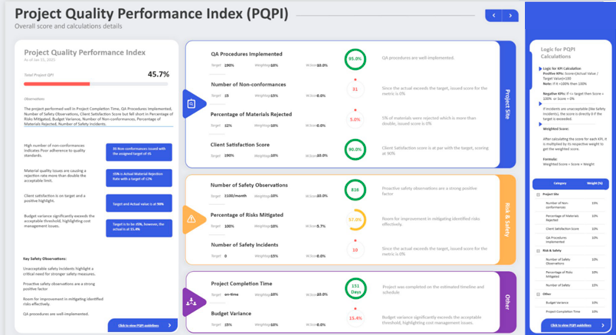
We designed a full Executive Intelligence suite: a live programme dashboard, contractor delay
timelines, a 5-dimension performance evaluation scorecard, and a bespoke Project Quality Performance Index (PQPI) — all interconnected and refreshed automatically. Leadership could filter by contractor, view budget variance against original contract values, and receive AI-generated findings and recommendations in a single panel.
Contractors Tracked
Contractors Tracked
SAR Portfolio
NCRs Surface
Before this dashboard, our weekly reports were assembled manually from 21 spreadsheets sent by each contractor. We were always two weeks behind reality. Now our leadership walks into every meeting with a live picture of the whole programme — delays, budget, quality, safety — on one screen.
THE CHALLENGE
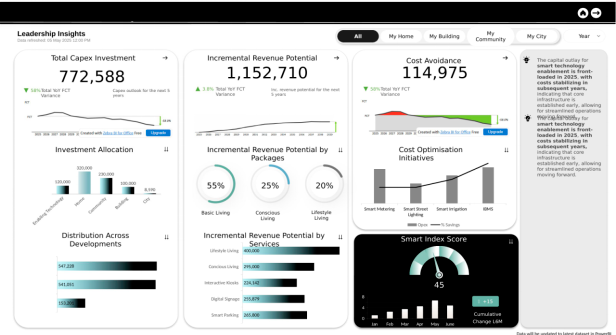
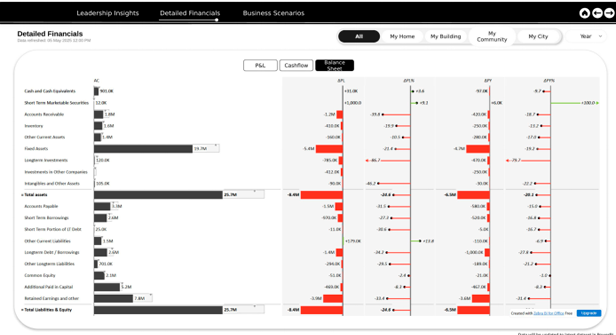
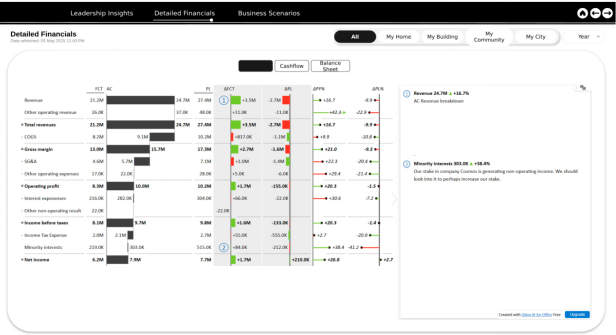
A government-backed real estate developer managing a multi-billion AED smart city portfolio across three large-scale residential and mixed-use developments had no unified way to see total investment exposure, model financial returns, simulate technology pricing scenarios, or track how smart infrastructure was performing against plan. Financial data was siloed across developments with no consolidated P&L, cashflow, or balance sheet visibility at portfolio level.
THE SOLUTION
We built a three-module Leadership Intelligence Platform entirely in Power BI. The Leadership Insights module gave the C-suite a live view of total Capex investment in AED, incremental revenue potential broken down by package type (Basic Living, Conscious Living, Lifestyle Living) and by service, cost avoidance across smart metering, street lighting, irrigation, and building management systems, and a Smart Index Score tracking technology readiness across each development. The Detailed Financials module delivered full P&L, Cashflow, and Balance Sheet views with forecast-vs-actual variance, prior year comparisons, and AI-generated narrative insights automatically pinpointing anomalies. The Business Scenarios module enabled leadership to run live financial simulations — adjusting cost lines and seeing downstream impact on net profit, gross margin, and tax across a 40-node decision tree in real time.
Multi-Billion Portfolio Currency
Modules: Insights Financials Scenarios
Developments Tracked
Scenario Nodes
We can now sit with investors and run live scenarios in the room. The P&L and cashflow views gave our CFO one version of the truth across all three developments in AED, with variance explained automatically. The scenario engine alone changed how we approach capital allocation decisions.
THE CHALLENGE
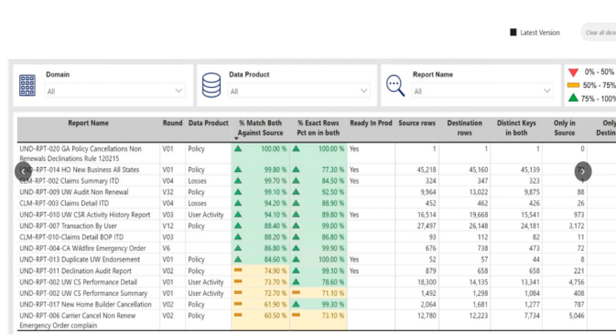
A North American insurance group mid-migration to a new reporting platform had 14+ report types across three data domains (Policy, Losses, User Activity) and up to 45,000+ rows per report. The team had no systematic way to detect whether destination data matched the source — silent data drift posed significant regulatory and business risk with no way to audit before go-live.
THE SOLUTION
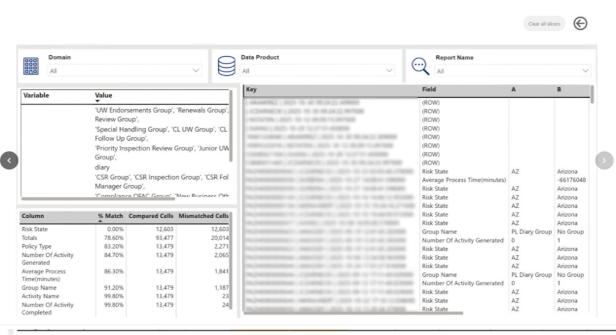
We built a two-layer validation suite in Power BI. The General Overview ranked every report by match rate with colour-coded confidence bands (0–50% red, 50–75% amber, 75–100% green) alongside row counts, distinct keys, and source-vs-destination discrepancies. The Column Match drill-through enabled row-level inspection — showing exactly which fields were mismatched so the team could investigate
individual records before signoff.
Reports Validated
Rows Per Report
Domain Coverage
Data Domain
This tooling gave our migration team the confidence to go live. We could see exactly which columns were drifting and drill into the exact rows causing discrepancies — something we had never had before. It completely changed our QA process.
THE CHALLENGE
A manufacturing company growing headcount by nearly 20% in a single year had no structured way to monitor absenteeism trends, understand turnover drivers, or identify employees approaching milestone benefit entitlements. HR leadership lacked both early warning signals and the forward-looking models needed to manage a growing workforce proactively.
THE SOLUTION
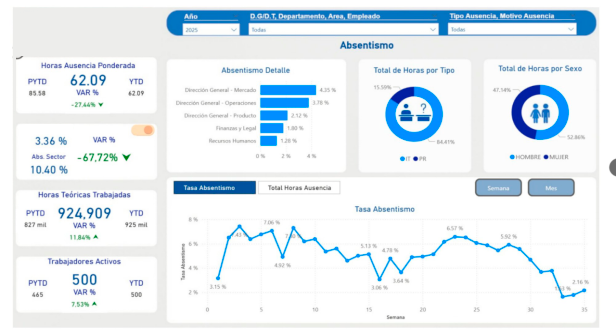
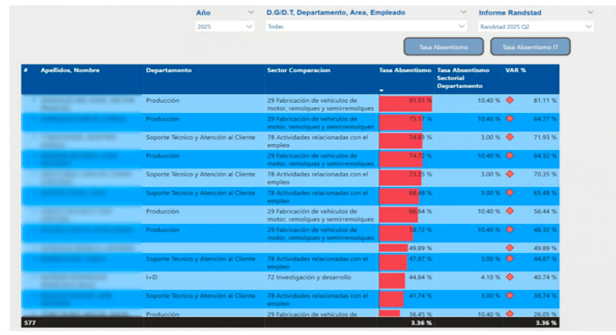
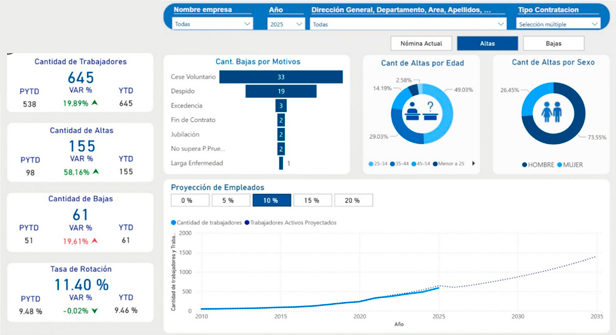
We delivered a four-module HR Analytics Platform. The Absenteeism module tracked weekly and monthly absence rates with sector benchmarking, gender and department breakdowns, and PYTD vs YTD variance. The Employee Detail module ranked individuals by absenteeism rate for targeted intervention. The Headcount & Turnover dashboard tracked hires, departures, and rotation rate alongside a 10-year projection model. The Benefits Plan module identified all employees qualifying for milestone entitlements (5, 10, 15, 20 years) with automated year-on-year change tracking.
Multi-Billion Portfolio Currency
Modules: Insights Financials Scenarios
Developments Tracked
Scenario Nodes
We finally have an HR dashboard that our directors actually open. The absenteeism tracking helped us address two at-risk departments before things escalated. And we discovered employees who had been missing out on benefits they were entitled to — the dashboard paid for itself the moment we ran the first report.
How integrated analytics, automation, and real-time dashboards transformed fragmented operations into faster, smarter decision-making.
Meraqi data Copyright © 2026 All rights reserved.